

In the fast-paced world of technical analysis, candlestick patterns are essential for understanding price movements in various market conditions. One standout pattern is the Dragonfly Doji Candlestick Pattern, which can help traders identify potential trade signals.
In this article, we will delve into the Dragonfly Doji Candlestick pattern, exploring its formation, psychology, trading ideas and how traders can use this information to make informed decisions and identify trade opportunities.
Dragonfly Doji Candlestick Pattern – Defintion
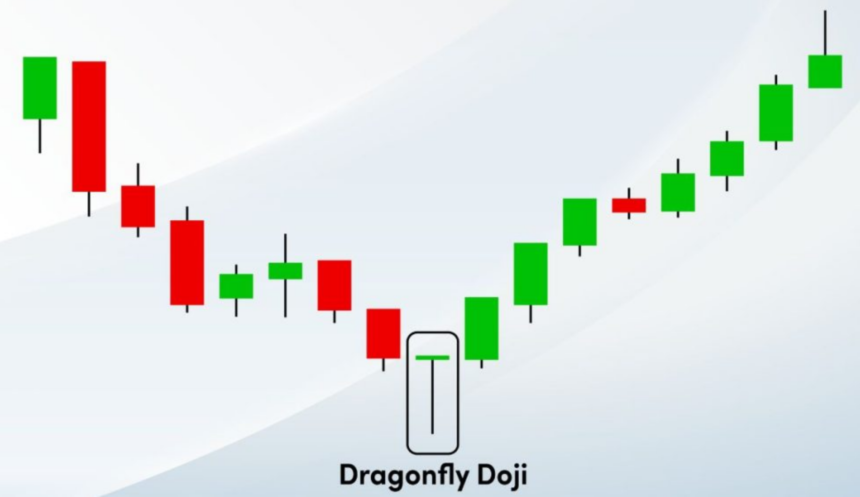
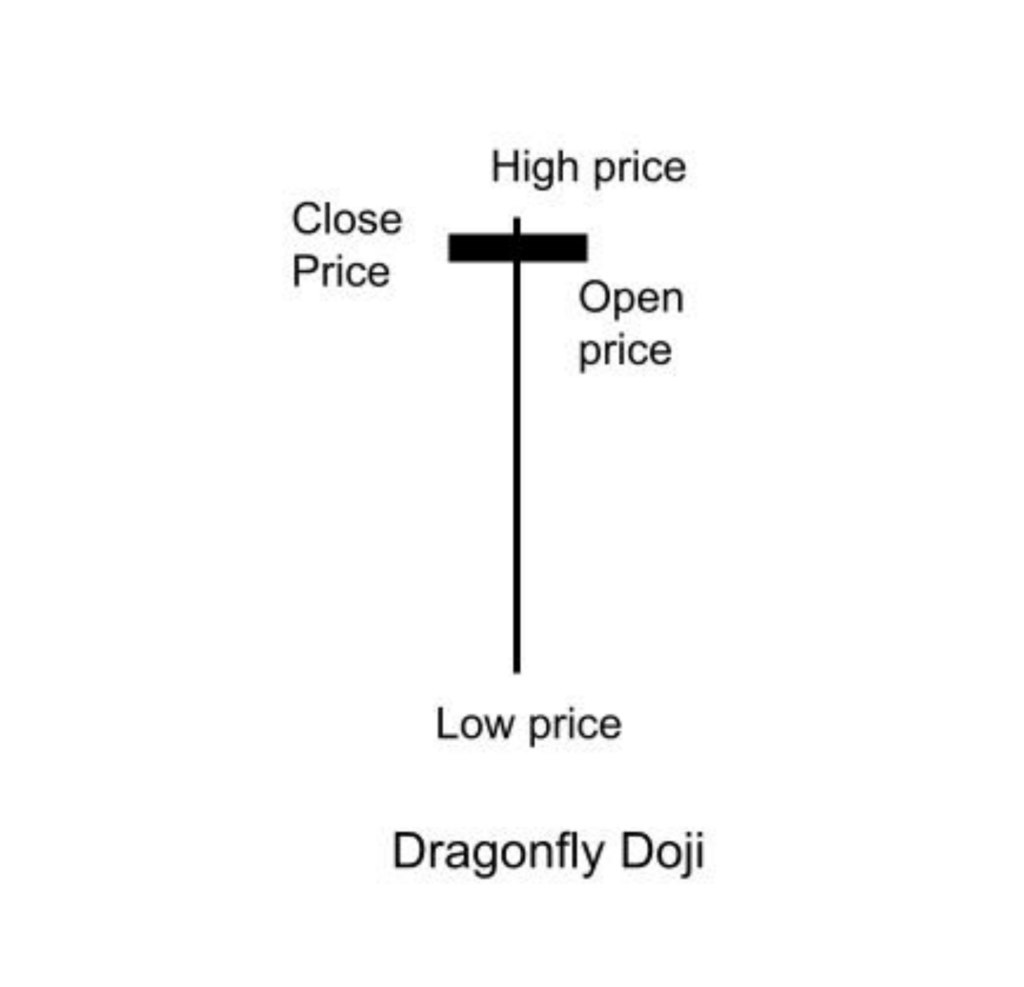
The Dragonfly Doji is a type of Doji candlestick pattern formed by a long lower shadow with the same open, close and high price of a security.
Unlike the Doji star, which indicates indecision, the dragonfly candlestick signals a reversal. However, the Dragonfly Doji can also be found at the end of an uptrend, but it sounds more reliable when formed at the end of a downtrend, signalling the possibility of a bullish reversal.
Dragonfly Doji Candlestick Pattern – Psychology
The Dragonfly Doji reflects a potential shift in market sentiment from bearish to bullish. During the period of the candle, bears initially push the price lower, but buyers step in and drive the price back up, rejecting the lower price levels resulting in an equilibrium between the buyers and sellers.
This pattern indicates a possible loss of momentum for the bears and hints at a potential trend reversal, as buyers regain control. The long lower shadow represents the struggle between buyers and sellers, suggesting uncertainty about the future direction of the security’s price. The recovery to the opening price suggests buyers are entering the market, seeing value at lower prices.
Dragonfly Doji Candlestick Pattern – Trading Ideas
With a good understanding of the Dragonfly Doji pattern formation and its significance, let’s explore some trading strategies.
Bullish reversal
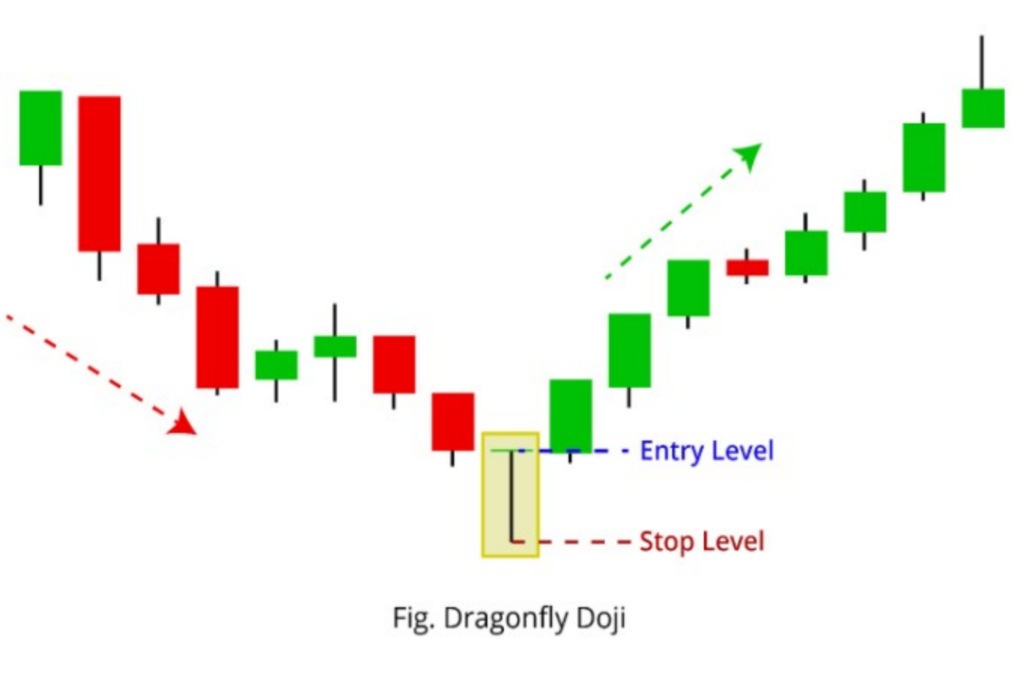
In a strong downtrend, the formation of the Dragonfly doji pattern indicates the end of a bearish trend. It signals a reversal for traders to consider entering a position.
Entry:- Enter a long position in a security when the price closes above the high of the Dragonfly Doji candlestick pattern formation.
Stop loss:- The logical stop loss will be set at the low price of the Dragonfly doji pattern.
Profit Target:- As the pattern doesn’t define any specific target levels, you can place the targets based on the risk-reward ratios or the next resistance level spotted in the chart.
Profit booking in a short position
The pattern formation helps traders to spot technical exits to the existing positions in the security. If you have placed a short position in the security, the formation of the Dragonfly doji pattern indicates an indecision or trend reversal. Hence, traders can square off the existing short position after the formation of the pattern to limit the further cut in profits.
Dragonfly Doji Candlestick Pattern – Example
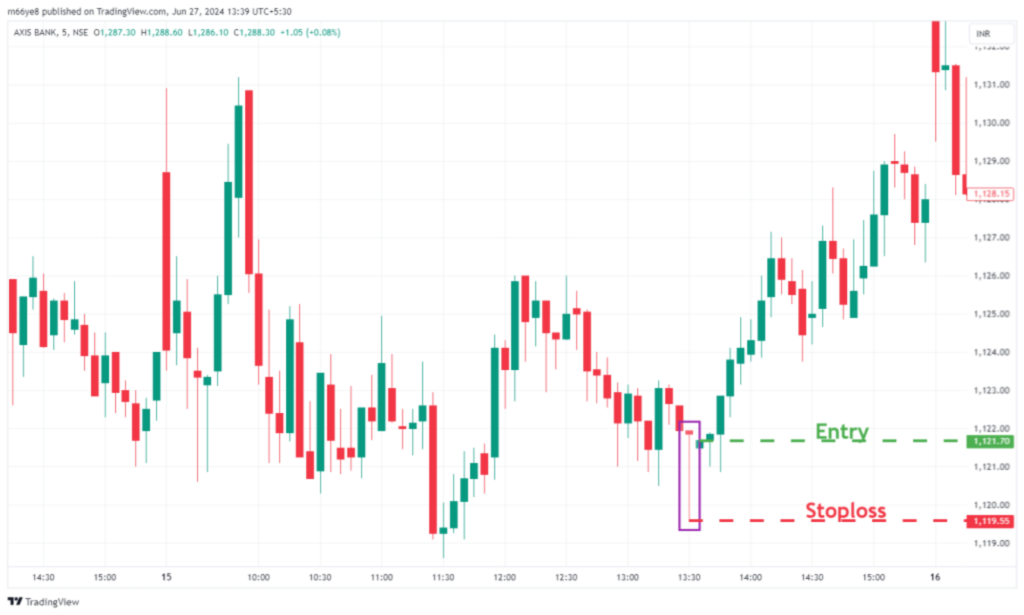
In the above chart of Axis Bank, we can observe the formation of the Dragonfly Doji candlestick pattern.
At the time of the formation of this pattern, a trader could have taken a long position when the price of the stock started trading above Rs. 1121.70 and the stop loss was at Rs. 1119.55.
Limitations Of Dragonfly Doji
- The Dragonfly doji pattern can produce false signals, leading to losses.
- The effectiveness of the pattern may vary depending on market conditions.
- The pattern formation with a prior uptrend is often not so reliable.
- The Dragonfly Doji pattern requires confirmation by a subsequent bullish candle or another technical indicator to avoid false breakouts or reversals.
Conclusion
The dragonfly doji is a key candlestick for traders to identify a potential bullish reversal in security. Understanding its formation, strategies and limitations, helps traders to make informed trading decisions.
Traders should always confirm the pattern formation in conjunction with other technical tools to avoid false signals. Also, having proper risk management with good risk-reward ratios and practice makes a trader profitable in the long run.
Next post :- Gulf Jobs Today Assignment Abroad Times PDF 24th July 2024