
Neutral Doji Candlestick Pattern: Candlestick patterns are an essential part of technical analysis used by traders to interpret market sentiment and predict potential price movements in securities.
In this article, we’ll explore the neutral doji candlestick pattern, its meaning, types, and how to incorporate it into your trading strategy.
Neutral Doji Candlestick Pattern – Definition
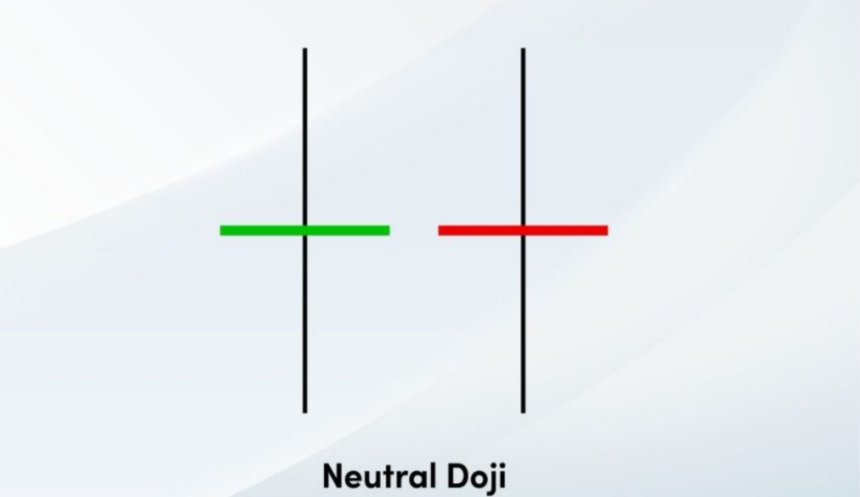
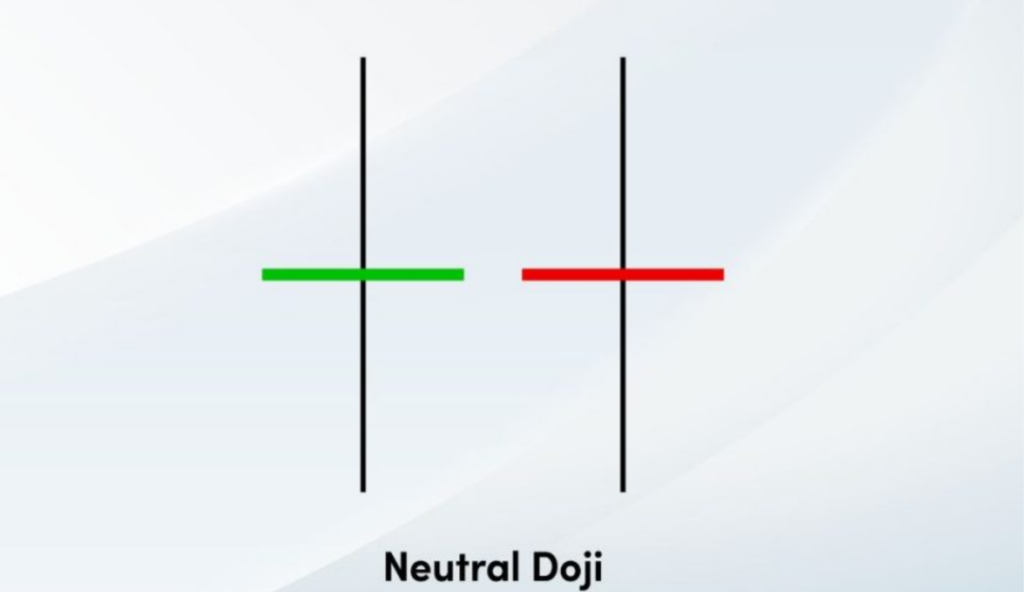
The Neutral Doji is a candlestick pattern that indicates indecision in the market. It occurs when the opening and closing prices of an asset are virtually equal, resulting in a very small or non-existent body. The pattern resembles a cross or plus sign, with upper and lower shadows of approximately equal length.
This pattern suggests that neither buyers nor sellers have gained control, resulting in a standoff. The Neutral Doji can appear in any trend and is often considered a potential reversal signal when found at the end of a strong uptrend or downtrend.
Neutral Doji Candlestick Pattern – Psychology
The psychology behind the Neutral Doji pattern suggests a balance between bullish and bearish forces in the market. During the candlestick formation, both buyers and sellers exert equal pressure, causing the price to open and close at nearly the same level.
This equilibrium indicates uncertainty among market participants about the future direction of the security. The Neutral Doji often indicates a temporary halt in the current trend and may precede a potential reversal or continuation, depending on the price action of the security.
Neutral Doji Candlestick Pattern – Trading Ideas
Long Position
Entry: After the formation of the neutral doji pattern, if the next candle closes above the pattern, a long position can be placed. Stop loss: Stop loss for the long position can be placed at the low of the neutral doji pattern formed.
Profit Target: The profit target can be set based on nearby resistance levels or using a predetermined risk-reward ratio.
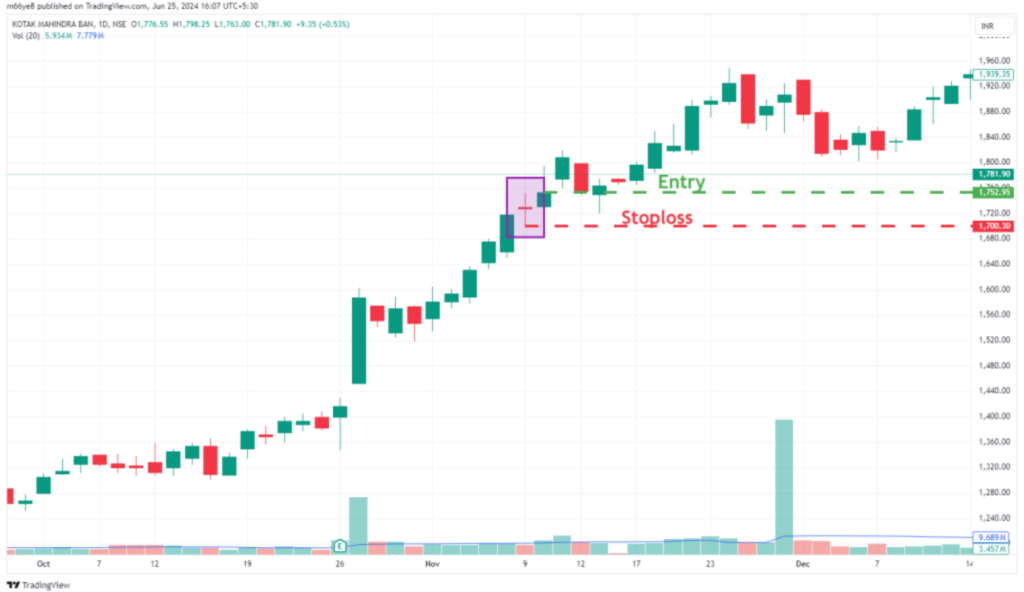
In the above chart of Kotak Mahindra Bank, we can observe the formation of the neutral Doji candlestick pattern in an uptrend. As discussed in this article, the price saw a continuation in trend after the formation of the pattern.
At the time of the formation of this pattern, a trader could have taken a long position when the price of the stock started trading above Rs. 1781.90 and the stop loss was at Rs. 1700.30.
Short Position
Entry: After the formation of the neutral doji pattern, if the next candle closes below the pattern, a short position can be placed.
Stop loss: Stop loss for the short position can be placed at the high of the neutral doji pattern formed.
Profit Target: The profit target can be set based on nearby support levels or using a predetermined risk-reward ratio.
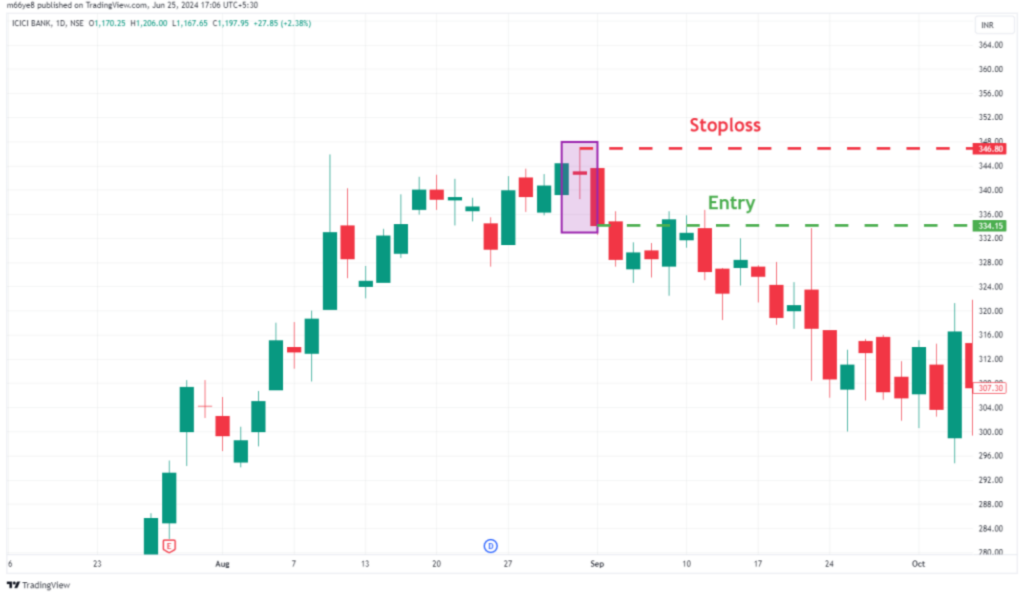
In the above chart of ICICI Bank, we can observe the formation of the neutral Doji candlestick pattern in an uptrend. As discussed in this article, the price saw a change in trend after the formation of the pattern.
At the time of the formation of this pattern, a trader could have taken a short position when the price of the stock started trading below Rs. 334.15 and the stop loss was at Rs. 346.80.
Also, as the pattern indicates a clear indecision present in the security one can anticipate a trend continuation or reversal.
Aspects To Confirm The Pattern
- The opening and closing prices should be very close or identical.
- Upper and lower shadows should be of approximately equal length.
- The pattern’s significance increases when it appears after a strong trend or at key support/resistance levels.
- Volume can provide additional confirmation, with higher volume suggesting stronger indecision.
Next post :- Dragonfly Doji Candlestick Pattern – Psychology And Trading Ideas